Browse Our Directory
Showing 3799–3807 of 4929 resultsSorted by latest
-
Convert all relations to third normal form
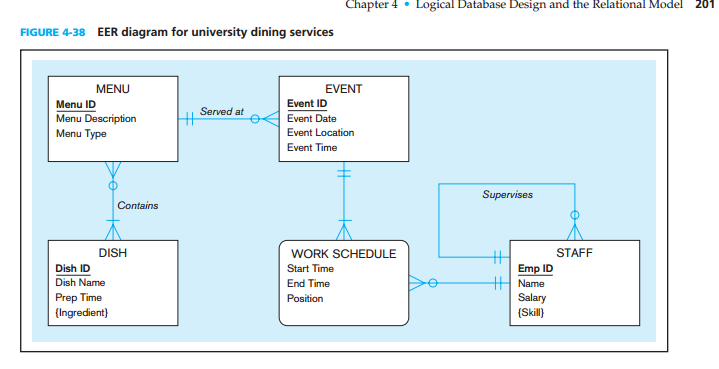
$1.0024. Figure 4-38 shows an EER diagram for a university dining service organization that provides dining services to a major university.
Convert all relations to third normal form, if necessary, and draw a revised relational schema.
Suppose that a country is experiencing a trade deficit
$1.00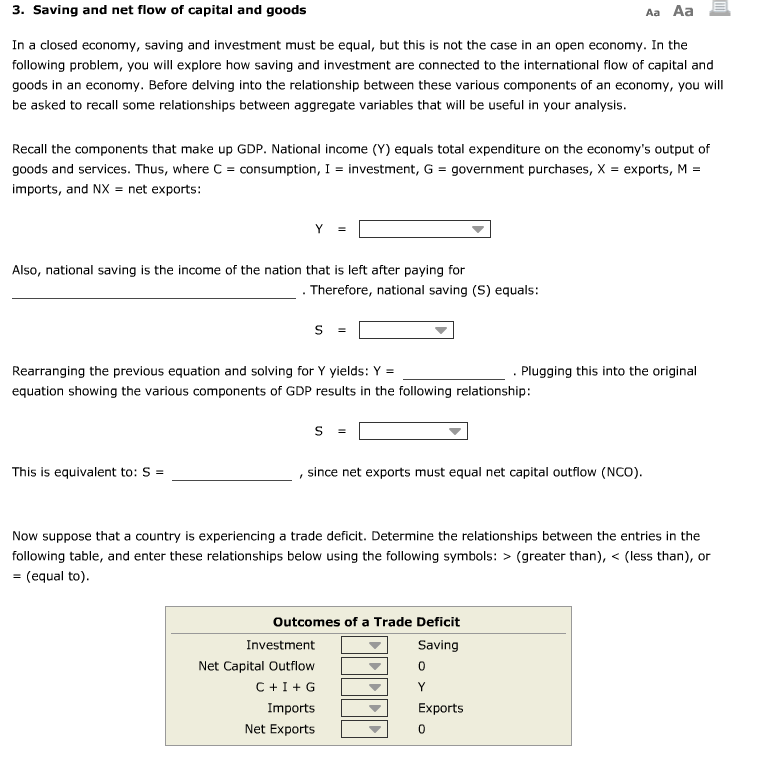
Text: In a closed economy, saving and investment must be equal, but this is not the case in an open economy. In the following problem, you will explore how saving and investment are connected to the international flow of capital and goods in an economy. Before delving into the relationship between these various components of an economy, you will be asked to recall some relationships between aggregate variables that will be useful in your analysis. Recall the components that make up GDP. National income (Y) equals total expenditure on the economy’s output of goods and services. Thus, where C = consumption, I = investment, G = government purchases, X = exports, M = imports, and NX = net exports: Also, national saving is the income of the nation that is left after paying for . Therefore, national saving (S) equals: Rearranging the previous equation and solving for Y yields: Y = . Plugging this into the original equation showing the various components of GDP results in the following relationship: This is equivalent to: S = , since net exports must equal net capital outflow (NCO). Now suppose that a country is experiencing a trade deficit. Determine the relationships between the entries in the following table, and enter these relationships below using the following symbols: > (greater than), < (less than), or = (equal to).
Jane’s case
$2.00Jane is concerned that she could have prevented herself from getting an autoimmune disease. (a) What are some risk factors for development of autoimmune diseases in general? (b) Looking at these risk factors, could Jane have done anything to prevent the development of her disease? Why or why not?


Time spent in the examination rooms
$7.50One particular morning, the length of time spent in the examination rooms is recorded for each patient seen by each physician at an orthopedic clinic. Time in Examination Rooms (minutes) Physician 1 Physician 2 Physician 3 Physician 4 33 34 18 27 25 34 32 30 25 29 30 31 32 33 25 25 27 41 32 34 36 32 30 32 20 25 43 28 Fill in the missing data. (Round your p-value to 4 decimal places, mean values to 1 decimal place and other answers to 3 decimal places.) Treatment Mean n Std. Dev Physician 1 Physician 2 Physician 3 Physician 4 Total One-Factor ANOVA Source SS df MS F p-value Treatment Error Total (a) Based on the given hypothesis, choose the correct option. H0: ?1 = ?2 = ?3 = ?4 H1: Not all the means are equal. ? = 0.05 Reject null hypothesis if F < 3.01 Reject null hypothesis if F > 3.01 (b) Calculate the F for one factor. (Round your answer to 2 decimal places.) F for one factor is (c) “On the basis of the above findings, we reject the null hypothesis”. Is the statement true? Yes No Northeast Medical Group Case Study
$5.00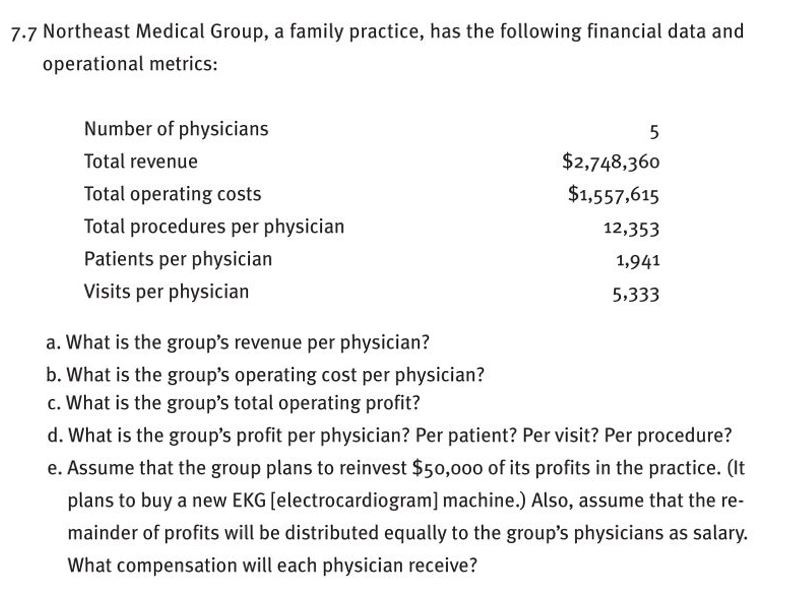
Northeast Medical Group Case Study
7.7 Northeast Medical Group, a family practice, has the following financial data and operational metrics: Number of physicians Total revenue $2,748,360 Total operating costs $1,557,615 Total procedures per physician 12,353 Patients per physician 1,941 Visits per physician 5,333
- a. What is the group?s revenue per physician?
- b. What is the group?s operating cost per physician?
- c. What is the group?s total operating profit?
- d. What is the group?s profit per physician? Per patient? Per visit? Per procedure?
- e. Assume that the group plans to reinvest $50,000 of its profits in the practice. (It plans to buy a new EKG [electrocardiogram] machine.) Also, assume that the re mainder of profits will be distributed equally to the group?s physicians as salary. What compensation will each physician receive?
Handy-Man Services Case Study
$2.00Handy-Man Services Case Study
Handy-Man Services is a repair-service company specializing in small household jobs. Each client pays a fixed monthly service fee based on the number of rooms in the house. Records are kept on the time and material costs used for each repair. The following profitability data apply to five customers.
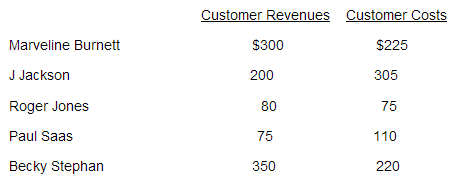
Question 1:Compute the operating income for each of the five customers. (five points)
Question 2:What options should Handy-Man Services consider in light of the customer-profitability results? (five points)
Question 3: What problems might Handy-Man Services encounter in accurately estimating the operating costs of each customer? (five points)
John Isaac Inc. Case
$2.00John Isaac Inc., a designer and installer of industrial signs, employs 60 people. The company recorded the type of the most recent visit to a doctor by each employee. A national assessment conducted in 2014 found that 53% of all physician visits were to primary care physicians, 19% to medical specialists, 17% to surgical specialists and 11% to emergency departments. Test at the 0.01 significance level if Isaac employees differ significantly from the survey distribution. Here are their results:
Visit Type Number of Visits Primary care 29 Medical specialist 11 Surgical specialist 16 Emergency 4 e State the decision rule. Use 0.01 significance level. (Round your answer to 3 decimal places.) H0: The employee visits do not differ from the survey distribution.. H1: The employee visits differ from the survey distribution. Reject H0 if 2 >________
Compute the value of chi-square. (Round your answer to 2 decimal places.) 2 = ________
Physician Visits Case Study
$5.00The state Medicaid agency has set a rate of $5.50 per visit for all Medicaid enrollees who visit a physician. Each physician also has private paying patients. The demand curve for each physician can be characterized as follows, and physicians can be regarded as individual monopolists. Each physician also has a cost schedule that can be characterized as follows:
Quantity of visits provided Total cost
0 $5
1 $7
2 $11
3 $17
4 $25
5 $35
6 $47a. If each physician is a profit maximizing provider, how many visits will he/she provide to public and private patients?
b. What will the number of visits provided be if the Medicaid Agency lowers its rate to $3 per visit, but the demand remains the same?Modern Healthcare Case Study
$5.00Modern Healthcare, a group practice clinic with 10 physicians, had the following income in 2014:
Revenue $3,350,000 Less operating expenses: Salaries Physicians $1,290,000 Nurses 150,000 Nursing aide 67,000 Receptionist 51,000 Accounting services 49,000 Training 121,000 Supplies 250,000 Phone and fax 3,650 Insurance 270,000 Depreciation 236,000 Utilities 21,600 Miscellaneous 61,000 Total operating expenses 2,570,250 Income before taxes 779,750 Less taxes on income 233,925 Net income $545,825 Prepare a budgeted income statement for Modern Healthcare for the year 2015.
The following changes are expected in 2015:1. The clinic is expecting a 2 percent decline in revenues because of increasing pressure from insurance companies. 2. Physicians are planning to hire a physician assistant at a salary of $54,000 per year. 3. Training costs are expected to increase by $18,000. 4. Supplies are expected to increase to be 10 percent of revenue. 5. Phone, fax, and insurance amounts will stay the same. 6. Depreciation expense will increase by $19,000 per year, since the clinic is planning to purchase equipment for $125,000. 7. Utilities and miscellaneous expenses are expected to increase by 5 percent next year. 8. Taxes on income will be 30 percent.
